2025-08-08 Jan Spörer's Health Data
Quick Explanation of Why I Post All My Health Data Here
I think health data is among the least important data to safeguard.
Research and development of medical technology and pharmaceutics is held back not at last due to strict regulations around data privacy. This is a disgrace, and I still have not heard from anybody a good argument of why people are keeping their health information private. Almost anybody I talk to wants their health data to be held securely – and when I ask them why, people seem to start thinking about this question for the first time in their lives and don’t seem to be able to come up with any specific reason.
So anyway, until proven otherwise, I will keep publishing my health data here.
The clear advantage is – if I ever get into an accident, or forget to bring my medical records to a doctor’s appointment – I can just tell the doctor to open Google and get my health data from my blog.
Ok – I found one good reason to not publish one’s health data – if the data is bad, it might bar you from getting (cheap) health insurance.
Blood Type, Blood Pressure, and Blood Sugar
- Type: B, Rh(D) pos K neg, CcD.ee.
- Can receive blood from Type B and Type O donors
- Can donate to Type B and Type AB recipients
- Rh:
- D antigen (Rh positive)
- Lack of Kell antigen
- Rh phenotype detail (CcD.ee):
- C: Present (C antigen positive)
- c: Present (c antigen positive)
- D: Present (Rh-positive)
- e: Present (e antigen positive)
- E: Absent (E antigen negative, shown by lowercase “e”)
- Type B occurs in approx. 8–9% of the Western population.
- Quite compatible for receiving transfusions – can accept both B+ and O+ blood (which together represent about 45-50% of donors), and the K-negative status eliminates potential complications from Kell antibodies.
-
Blood pressure: My blood pressure is usually in line with healthly baselines, but it could be even better, given my age (30 yo at the time of the last measurement).
- Blood sugar: Is also always ok. Reference: Should be less than 100mg/dL fasted and less than 140mg/dL after eating.
- 2026-05-12: 96 mg/dL fasted (lab). HbA1c 5.3%. Mean glucose 106.3 mg/dL (from HbA1c). HOMA-Score 0.9 (good).
- 2025-11-08: 127mg/dL at 13:50 about 1h after eating.
- Blood pressure
- 2026-05-12: three readings during the cardiology workup that morning:
- 09:47 (ABI device, boso): 124/76 (right arm) and 124/78 (left arm) — essentially identical to my April 2025 baseline of 120/70
- 09:53 (Arteriograph, 6 min later): 139/87
- 10:34 (stress test pre-exercise, on the bike): 142/89
- Central aortic SBP: 124.6 mmHg (normal)
- The 15 mmHg systolic gap between the ABI and the Arteriograph 6 minutes later is hard to attribute to anything other than white-coat / measurement-context effect. My actual resting BP is fine — the Arteriograph and pre-stress readings were context-elevated, not a true sustained increase.
- 2025-04-01: 120/70 blood pressure at 8:26am. Day before: Went to bed at midnight, woke up at 7am, ate hash browns and fried Austrian dumplings/Knödel (unhealthy stuff). Had a slight headache that day.
- 2026-05-12: three readings during the cardiology workup that morning:
Weight and Body Composition
- 2026-05-12 seca mBCA Body Composition Analysis (different device than InBody, so direct comparisons should be treated cautiously):
- Weight: 76.8 kg
- Height: 183.1 cm
- BMI: 22.9 kg/m² (Normalgewicht)
- Waist circumference: 76.0 cm
- Visceral fat: < 0.2 L (excellent, deep in the green zone)
- Body fat: 14.3% (10.99 kg)
- Fat-Mass-Index (FMI): 3.3 kg/m²
- Total skeletal muscle mass: 32.77 kg (80th percentile for age)
- Segmental skeletal muscle mass:
- Torso: 15.24 kg
- Right arm: 2.21 kg
- Left arm: 2.13 kg
- Right leg: 6.63 kg
- Left leg: 6.57 kg
- Total body water (TBW): 48.2 L (62.4% of body mass)
- Extracellular water (ECW): 19 L (24.6% of body mass)
- ECW/TBW ratio: 39.5% (normal range 38.4-41.9)
- Resting Energy Expenditure (REE): 7.7 MJ/day = 1841 kcal/day
- Phasenwinkel: 6.4° (80th percentile)
- Honest note: Weight is up about 6 kg from 2025 and body fat is roughly 6 kg higher than in 2022. Still firmly in the “normal” zone on every official metric (BMI, body fat %, visceral fat, muscle mass percentile), but the trend is real and I should address it.
- 2025: Around 71kg. Lost muscle.
- 2023-03-11 20:34 InBody Body Composition Analysis:
- 74/100 score.
- 47.5kg total water
- 12.8kg proteins
- -> Equals 61.2kg soft lean mass
- 4.48kg minerals.
- -> Equals 64.8kg lean body mass.
- 5.7kg fat.
- 70.5kg total weight.
- Muscle-fat analysis
- 36.7kg SSM (sceletal muscle mass)
- 5.7kg Body fat mass
- Fat analysis:
- 20.4 BMI
- 8.2% body fat
- 19.7 $VFB_{cm^2}$ visceral fat
- Segmented lean analysis:
- Right arm:
- 3.73kg
- 111.3% of baseline
- Left arm:
- 3.61kg
- 107.7% of baseline
- Trunk:
- 28.3kg
- 106.3% of baseline
- Right leg:
- 10.75kg
- 115.3% of baseline
- Left leg:
- 10.64kg
- 114.6% of baseline
- Right arm:
- Body water analysis:
- EZW/GKW ratio: 0.376 (normal)
- Phasenwinkel: 6.2 degrees.
- 2023-02-22 21:14 InBody Body Composition Analysis:
- 76/100 score.
- 48.9kg total water
- 13.2kg proteins
- -> Equals 62.9kg soft lean mass
- 4.50kg minerals.
- -> Equals 66.6kg lean body mass.
- 4.0kg fat.
- 70.6kg total weight.
- Muscle-fat analysis
- 37.8kg SSM (sceletal muscle mass)
- 4.0kg Body fat mass
- Fat analysis:
- 20.4 BMI
- 5.6% body fat
- 10.5 $VFB_{cm^2}$ visceral fat
- Segmented lean analysis:
- Right arm:
- 3.86kg
- 115.0% of baseline
- Left arm:
- 3.75kg
- 111.5% of baseline
- Trunk:
- 29.1kg
- 108.5% of baseline
- Right leg:
- 10.98kg
- 117.6% of baseline
- Left leg:
- 10.88kg
- 116.5% of baseline
- Right arm:
- Body water analysis:
- EZW/GKW ratio: 0.376 (normal)
- Phasenwinkel: 6.1 degrees.
- 2023-01-17 18:45 InBody Body Composition Analysis:
- 72/100 score.
- 46.2kg total water
- 12.5kg proteins
- -> Equals 59.5kg soft lean mass
- 4.26kg minerals.
- -> Equals 63.0kg lean body mass.
- 4.9kg fat.
- 67.9kg total weight.
- Muscle-fat analysis
- 35.8kg SSM (sceletal muscle mass)
- 4.9kg Body fat mass
- Fat analysis:
- 19.6 BMI
- 7.3% body fat
- 13.5 $VFB_{cm^2}$ visceral fat
- Segmented lean analysis:
- Right arm:
- 3.60kg
- 111.4% of baseline
- Left arm:
- 3.46kg
- 107.1% of baseline
- Trunk:
- 27.0kg
- 104.7% of baseline
- Right leg:
- 10.46kg
- 116.5% of baseline
- Left leg:
- 10.44kg
- 116.0% of baseline
- Right arm:
- Body water analysis:
- EZW/GKW ratio: 0.372 (normal)
- Phasenwinkel: 6.4 degrees.
- 2022-07: Around 75kg. All-time peak weight. Very fit (high in muscle mass).
- 2022-06-15 21:35 InBody Body Composition Analysis (first measurement):
- 83/100 score.
- 50.5kg total water
- 13.5kg proteins
- -> Equals 64.9kg soft lean mass
- 4.63kg minerals.
- -> Equals 68.7kg lean body mass.
- 5.1kg fat.
- 74.8kg total weight.
- Muscle-fat analysis
- 39.1kg SSM (sceletal muscle mass)
- 5.1kg Body fat mass
- Fat analysis:
- 21.6 BMI
- 8.1% body fat
- 21.3 $VFB_{cm^2}$ visceral fat
- Segmented lean analysis:
- Right arm:
- 3.99kg
- 112.1% of baseline
- Left arm:
- 3.88kg
- 108.9% of baseline
- Trunk:
- 29.9kg
- 104.9% of baseline
- Right leg:
- 11.33kg
- 114.6% of baseline
- Left leg:
- 11.25kg
- 113.8% of baseline
- Right arm:
- Body water analysis:
- EZW/GKW ratio: 0.375 (normal)
- Phasenwinkel: 6.4 degrees.
- 2022-06-15 21:35 InBody Body Composition Analysis (second measurement):
- 84/100 score.
- 51.0kg total water
- 13.5kg proteins
- -> Equals 65.6kg soft lean mass
- 4.63kg minerals.
- -> Equals 69.5kg lean body mass.
- 5.3kg fat.
- 74.8kg total weight.
- Muscle-fat analysis
- 39.6kg SSM (sceletal muscle mass)
- 5.3kg Body fat mass
- Fat analysis:
- 21.6 BMI
- 7.0% body fat
- 18.9 $VFB_{cm^2}$ visceral fat
- Segmented lean analysis:
- Right arm:
- 4.00kg
- 113.9% of baseline
- Left arm:
- 3.89kg
- 109.2% of baseline
- Trunk:
- 30.0kg
- 105.0% of baseline
- Right leg:
- 11.31kg
- 114.3% of baseline
- Left leg:
- 11.27kg
- 114.0% of baseline
- Right arm:
- Body water analysis:
- EZW/GKW ratio: 0.374 (normal)
- Phasenwinkel: 6.3 degrees.
- 2022-04-03 20:33 InBody Body Composition Analysis:
- 84/100 score.
- 51.3kg total water
- 13.6kg proteins
- -> Equals 66.1kg soft lean mass
- 4.84kg minerals.
- -> Equals 70.1kg lean body mass.
- 4.7kg fat.
- 74.8kg total weight.
- Muscle-fat analysis
- 40.0kg SSM (sceletal muscle mass)
- 4.7kg Body fat mass
- Fat analysis:
- 21.6 BMI
- 6.3% body fat
- 13.6 $VFB_{cm^2}$ visceral fat
- Segmented lean analysis:
- Right arm:
- 4.00kg
- 116.4% of baseline
- Left arm:
- 4.00kg
- 112.5% of baseline
- Trunk:
- 30.6kg
- 107.9% of baseline
- Right leg:
- 10.97kg
- 110.9% of baseline
- Left leg:
- 10.95kg
- 110.7% of baseline
- Right arm:
- Body water analysis:
- EZW/GKW ratio: 0.372 (normal)
- Phasenwinkel: 6.5 degrees.
- 2021-12-30 22:09 InBody Body Composition Analysis:
- 76/100 score.
- 48.6kg total water
- 13.1kg proteins
- -> Equals 62.5kg soft lean mass
- 4.49kg minerals.
- -> Equals 66.2kg lean body mass.
- 4.3kg fat.
- 70.5kg total weight.
- Muscle-fat analysis
- 37.6kg SSM (sceletal muscle mass)
- 4.3kg Body fat mass
- Fat analysis:
- 20.4 BMI
- 6.1% body fat
- 11.8 $VFB_{cm^2}$ visceral fat
- Segmented lean analysis:
- Right arm:
- 3.82kg
- 114.0% of baseline
- Left arm:
- 3.69kg
- 108.0% of baseline
- Trunk:
- 28.1kg
- 107.3% of baseline
- Right leg:
- 11.07kg
- 118.7% of baseline
- Left leg:
- 10.94kg
- 117.3% of baseline
- Right arm:
- Body water analysis:
- EZW/GKW ratio: 0.375 (normal)
- Phasenwinkel: 6.3 degrees.
- 2021-11-22 InBody Body Composition Analysis:
- 76/100 score.
- 48.6kg total water
- 13.2kg proteins
- -> Equals 62.6kg soft lean mass
- 4.5kg minerals.
- -> Equals 66.3kg lean body mass.
- 4.3kg fat.
- 70.6kg total weight.
- Muscle-fat analysis
- 37.7kg SSM (sceletal muscle mass)
- 4.3kg Body fat mass
- Fat analysis:
- 20.4 BMI
- 6.1% body fat
- 12.1 $VFB_{cm^2}$ visceral fat
- Segmented lean analysis:
- Right arm:
- 3.81kg
- 114.2% of baseline
- Left arm:
- 3.71kg
- 110.4% of baseline
- Trunk:
- 29.0kg
- 108.1% of baseline
- Right leg:
- 10.72kg
- 114.8% of baseline
- Left leg:
- 10.67kg
- 114.2% of baseline
- Right arm:
- Body water analysis:
- EZW/GKW ratio: 0.374 (normal)
- Changes:
- Weight increased from 66.1kg (2021-08-13) to 70.6kg
- Sceletal muscle mass increased from 34.2kg to 37.7kg
- Body fat percentage decreased from 8.1% to 6.1%.
- EZW/GKW ratio decreased from 0.378 to 0.374.
- Phasenwinkel: 6.2 degrees.
- 2021-08-13 19:16 InBody Body Composition Analysis:
- 70/100 score.
- 44.7kg total water
- 12.0kg proteins
- -> Equals 57.4kg soft lean mass
- 4.03kg minerals.
- -> Equals 60.7kg lean body mass.
- 6.4kg fat.
- 66.1kg total weight.
- Muscle-fat analysis
- 34.2kg SSM (sceletal muscle mass)
- 6.4kg Body fat mass
- Fat analysis:
- 19.2 BMI
- 8.1% body fat
- 19.2 $VFB_{cm^2}$ visceral fat
- Segmented lean analysis:
- Right arm:
- 3.41kg
- 108.4% of baseline
- Left arm:
- 3.31kg
- 105.4% of baseline
- Trunk:
- 26.7kg
- 106.4% of baseline
- Right leg:
- 10.29kg
- 117.7% of baseline
- Left leg:
- 10.26kg
- 117.3% of baseline
- Right arm:
- Body water analysis:
- EZW/GKW ratio: 0.378 (normal)
- Phasenwinkel: 5.6 degrees.
- 2020-07-01 18:32 InBody Body Composition Analysis:
- 72/100 score.
- 46.3kg total water
- 12.3kg proteins
- -> Equals 59.4kg soft lean mass
- 4.26kg minerals.
- -> Equals 62.9kg lean body mass.
- 5.3kg fat.
- 68.2kg total weight.
- Muscle-fat analysis
- 35.3kg SSM (sceletal muscle mass)
- 5.3kg Body fat mass
- Fat analysis:
- 19.7 BMI
- 7.7% body fat
- 20.7 $VFB_{cm^2}$ visceral fat
- Segmented lean analysis:
- Right arm:
- 3.63kg
- 111.8% of baseline
- Left arm:
- 3.50kg
- 107.9% of baseline
- Trunk:
- 27.8kg
- 107.2% of baseline
- Right leg:
- 10.54kg
- 116.8% of baseline
- Left leg:
- 10.45kg
- 115.9% of baseline
- Right arm:
- Body water analysis:
- EZW/GKW ratio: 0.382 (normal)
- Phasenwinkel: 5.7 degrees.
- Before 2022: Slowly, yet steadily built up to 75kg. Around 65kg in 2015, with increases in weight depending on how frequently I did strength training. Always very low fat.
Strength & Fitness Milestones
- 2026-05-30: 20 consecutive strict pull-ups in a single set. A significant milestone for me and a sign that I am currently in a good state of training. Together with the 2026-05-12 stress test (250 W = 116% of target, max HR 178, MET 12.9 — terminated on muscular, not cardiac, exhaustion), this places my overall fitness in a clearly strong window despite the recent uptick in body fat.
Blood Work (Blutbild)
- 2026-05-12 (ordered by Die Kardiologen Bad Nauheim, lab: GANZIMMUN)
- Cardiac Markers (new):
- NT-proBNP: 14.17 pg/ml (reference: <125.00) — excellent, well below the cutoff for heart failure
- CK-MB: 14 U/l (reference: <25)
- Complete Blood Count:
- Hämoglobin: 15.1 g/dl (reference: 13.5-17.8)
- Erythrozyten: 5.15 Mio/µl (reference: 4.4-5.9)
- Hämatokrit: 45.6% (reference: 40-53)
- MCV: 88 fl (reference: 80-96)
- MCH: 29.4 pg (reference: 28-33)
- MCHC: 33.2 g/dl (reference: 33-36)
- Retikulozyten: 0.63% (reference: 0.42-2.23)
- Leukozyten: 4.2 Zellen/nl (reference: 3.9-10.9)
- Neutrophile: 55.3% / 2.3 Zellen/nl
- Lymphozyten: 30.3% / 1.26 Zellen/nl
- Monozyten: 9.1% / 0.38 Zellen/nl
- Eosinophile: 4.2% / 0.18 Zellen/nl
- Basophile: 1.1% / 0.05 Zellen/nl
- Thrombozyten: 154 /nl (reference: 137-327)
- MPV: 10.2 fl (reference: 7.6-10.7)
- RDW: 13.3% (reference: 12.1-16.2)
- Diabetes Markers:
- HbA1c: 5.3% (reference: <5.7)
- HbA1c (IFCC): 34.7 mmol/mol (reference: <39)
- Mittlere Glucosekonzentration: 106.3 mg/dl (reference: 68-126)
- Plasmaglukose nüchtern: 96 mg/dl (reference: 60-100)
- Insulin basal: 3.61 µIE/ml (reference: 3.21-16.32)
- HOMA-Score: 0.9 (reference: <2.0)
- Liver & Pancreas:
- GOT (AST): 31 U/l (reference: <51)
- GPT (ALT): 34 U/l (reference: <51)
- Gamma-GT: 22 U/l (reference: <60)
- GLDH: 4.2 U/l (reference: <7.0)
- LDH: 186 U/l (reference: <250)
- Alkalische Phosphatase: 81 U/l (reference: 40-129)
- Lipase: 28 U/l (reference: 13-60)
- Amylase: 49 U/l (reference: 28-100)
- CK-NAC: 159 U/l (reference: <190)
- Bilirubin gesamt: 0.3 mg/dl (reference: <1.2)
- Cholinesterase: 9.09 kU/l (reference: 5.32-12.92)
- Kidney Function:
- Kreatinin enzymatisch: 1.27 mg/dl (reference: 0.67-1.17) [SLIGHTLY ELEVATED] — same pattern as Nov 2025; likely my high muscle/creatine load is inflating the reading
- GFR CKD-EPI (Kreatinin): 74.6 ml/min/1.73m² (Stage 2: mild reduction)
- Cystatin C (IFCC): 0.93 mg/l (reference: 0.61-0.95)
- GFR CKD-EPI (Cystatin C): 96.2 ml/min/1.73m² — this is the more reliable estimator when creatinine is muscle-confounded, and it puts kidney function clearly in the normal range
- Harnstoff (Urea): 35.8 mg/dl (reference: 16.6-48.5)
- Harnsäure (Uric acid): 6.7 mg/dl (reference: 3.4-7)
- Lipid Panel (this is the worrying part — values went back up from Nov 2025 despite the coffee reduction):
- Lp(a) turbidimetrisch: 167 nmol/l (reference: <75) [HIGH]
- Lp(a): 78 mg/dl (reference: <36) [HIGH] (Oct 2025 was 63 mg/dl against reference <30, suggesting a different assay — the Oct 2025 vs. May 2026 comparison is therefore not a clean apples-to-apples reading; both are clearly elevated)
- Cholesterin gesamt: 215 mg/dl (reference: <200) [BORDERLINE HIGH] (was 188 in Nov 2025)
- LDL-Cholesterin: 150 mg/dl (reference: <116) [ELEVATED] (was 110 in Nov 2025)
- HDL-Cholesterin: 71 mg/dl (reference: >40, ≥60 = high/good)
- Non-HDL-Cholesterin: 144 mg/dl (reference: <145)
- Triglyceride: 68 mg/dl (reference: <150)
- Apolipoprotein B: 115 mg/dl (reference: 66-144) — within range but high-normal
- Iron Status (newly tested):
- Eisen: 62 µg/dl (reference: 33-193)
- Transferrin: 325 mg/dl (reference: 200-360)
- Transferrinsättigung: 13.6% (reference: 16-45) [LOW]
- Ferritin: 41.4 ng/ml (reference: 44.8-442) [LOW]
- Important caveat: I donated whole blood on 2026-04-24, only 18 days before this draw. A single donation typically drops ferritin by ~30 ng/ml and transferrin saturation along with it. So the low values are most likely transient post-donation and not evidence of underlying iron deficiency. Worth re-checking in a few months.
- Electrolytes:
- Natrium: 139 mmol/l (reference: 136-145)
- Kalium: 4.2 mmol/l (reference: 3.5-5.1)
- Magnesium i. Serum: 0.85 mmol/l (reference: 0.66-1.07)
- Calcium: 2.46 mmol/l (reference: 2.15-2.5)
- Chlorid: 102 mmol/l (reference: 98-107)
- Anorganisches Phosphat: 2.7 mg/dl (reference: 2.5-4.5)
- Immunoglobulins & Electrophoresis:
- IgA: 272 mg/dl (reference: 70-400)
- IgG: 1022 mg/dl (reference: 700-1600)
- IgM: 175 mg/dl (reference: 40-230)
- Gesamteiweiß: 7.3 g/dl (reference: 6.4-8.3)
- Albumin: 65.2% (reference: 55.8-66.1)
- Alpha-1-Globulin: 3% (reference: 2.9-4.9)
- Alpha-2-Globulin: 6.9% (reference: 7.1-11.8) [borderline low, clinically not concerning]
- Beta-1-Globulin: 6.8% (reference: 4.7-7.2)
- Beta-2-Globulin: 4.6% (reference: 3.2-6.5)
- Gamma-Globulin: 13.5% (reference: 11.1-18.8)
- Inflammation:
- BSG: 3 mm/h (reference: 2-28)
- CRP: 0.5 mg/l (reference: <10)
- Coagulation:
- Quick (Thromboplastinzeit): 115.4% (reference: 78.1-123.3)
- INR: 0.93 (reference: 0.9-1.15)
- PTT: 25.2 s (reference: 21.6-28.7)
- Hormones:
- TSH: 2.3 mIU/l (reference: 0.41-3.74) — down from 3.723 in Nov 2025
- Vitamins:
- Vitamin D: 92.48 ng/ml (reference: 30-70) [HIGH] — I’ve been supplementing 4,000–20,000 IU/day; this is well above target. Will reduce.
- Vitamin B12: 430 pg/ml (reference: 197-771)
- Other:
- Homocystein i. Plasma: 10.3 µmol/l (target <10, tolerable 10-12)
- Gesamt-IgE: 105 kU/l (reference: <20) [HIGH] — “Allergy likely” range (>100). I don’t currently have noticeable allergy symptoms, so this is news to me.
- Urinstatus: all unremarkable (no blood, no protein, no glucose, no ketones, no nitrite, no leukocytes; pH 5; specific gravity 1.005).
- Cardiac Markers (new):
- 2025-11-11
- Complete Blood Count (kl. BB m.Throm.):
- Hämoglobin (Hemoglobin): 15.1 g/dl (reference: 14.0-17.5)
- Erythrozyten (Red Blood Cells): 5.02 Mio/ul (reference: 4.50-5.90)
- Leukozyten (White Blood Cells): 6.06 Tsd./ul (reference: 4.40-11.30)
- MCH (Mean Corpuscular Hemoglobin): 30.1 pg (reference: 28.0-33.0)
- Hämatokrit (Hematocrit): 44.7 % (reference: 40.0-52.0)
- MCHC (Mean Corpuscular Hemoglobin Concentration): 33.8 g/dl (reference: 32.0-36.0)
- MCV (Mean Corpuscular Volume): 89.0 fl (reference: 80.0-96.0)
- Thrombozyten (Platelets): 147 Tsd/ul (reference: 140-440)
- Diabetes Markers:
- HbA1c (NGSP) (Glycated Hemoglobin): 5.19 % (reference: <5.7)
- HbA1c (IFCC): 33.2 mmol/mol (reference: <39)
- Glucose (Blood Sugar): 76 mg/dl (reference: 70-110)
- Liver Function:
- GOT (AST) (Aspartate Aminotransferase): 32 U/l (reference: <35)
- GPT (ALT) (Alanine Aminotransferase): 30 U/l (reference: <45)
- yGT (Gamma-Glutamyl Transferase): 18 U/l (reference: <55)
- Bilirubin gesamt (Total Bilirubin): 0.5 mg/dl (reference: 0.1-1.2)
- Bilirubin direkt (Direct Bilirubin): 0.09 mg/dl (reference: <0.3)
- Bilirubin indirekt (Indirect Bilirubin): 0.41 mg/dl (reference: 0.10-0.80)
- LDH (Lactate Dehydrogenase): 185 U/l (reference: <248)
- Amylase: 53 U/l (reference: <100)
- Lipase: 46 U/l (reference: <60)
- Kidney Function:
- Kreatinin (Creatinine): 1.30 mg/dl (reference: <1.20) [SLIGHTLY ELEVATED]
- GFR CKD-EPI (Glomerular Filtration Rate): 73 ml/min/1.73m² (based on CKD-EPI formula)
- Lipid Panel (Fettstoffwechsel):
- Gesamtcholesterin (Total Cholesterol): 188 mg/dl (reference: <200)
- HDL-Cholesterin (HDL Cholesterol): 57 mg/dl (reference: >40)
- LDL-Cholesterin enzymatisch (LDL Cholesterol): 110 mg/dl (reference: <130)
- LDL/HDL Ratio: 1.9 (reference: <3)
- Triglyzeride (Triglycerides): 49 mg/dl (reference: <200)
- Thyroid Function:
- TSH (Thyroid-Stimulating Hormone): 3.723 µU/ml (reference: 0.380-5.330)
- Complete Blood Count (kl. BB m.Throm.):
- 2025-10-08
- Blood Chemistry:
- Albumin: 43.32 g/l (reference range: 35.00-52.00)
- Lipoprotein(a)/Lp(a) (“Lp little a”): 63 mg/dl (reference range: <30) [HIGH] -> Very bad, I will address this and talk to my doctor about it in November. This marker is genetic and can only be effectively reduced with medication. Nutrition and sports have little to no effect on this metric, unfortunately.
- Testosteron: 4.69 ng/ml (reference range: 1.75-7.81)
- bioverfügbares Testosteron: 1.514 μg/l (reference range: 1.260-4.120)
- bioverfügbares Testosteron: 32.29 % (reference range: 35.00-66.30) [LOW]
- freies Testosteron: 0.0640 μg/l (reference range: 0.0570-0.1780)
- freies Testosteron: 1.370 % (reference range: 1.530-2.880) [LOW]
- SHBG: 60.5 nmol/l (reference range: 13.3-89.5)
- IGeL-Leistung (Additional Testing):
- Nicotinamid im Serum (LC/MS): 39.2 μg/L (reference range: 8.0-52.0)
- Blood Chemistry:
- 2025-04-01
- Klinische Chemie (Clinical Chemistry):
- Cortisol im Serum: 9.09 μg/dl (reference range: 5.00-23.00)
- Albumin: 46.21 g/l (reference range: 35.00-52.00)
- Immunologie (Immunology):
- Vitamin D total (25-OH) (CLIA): 13.8 ng/ml (reference range: > 30)
- Testosteron: 2.76 ng/ml (reference range: 1.75-7.81)
- bioverfügbares Testosteron: 1.554 μg/l (reference range: 1.200-4.120)
- bioverfügbares Testosteron: 32.65 % (reference range: 26.00-66.30)
- freies Testosteron: 0.0620 μg/l (reference range: 0.0570-0.1780)
- freies Testosteron: 1.300 % (reference range: 1.530-2.880)
- SHBG: 62.9 nmol/l (reference range: 13.3-89.5)
- Hämoglobin (Hemoglobin): 15.2 g/dl (reference: 14.0-17.5)
- Erythrozyten (Red Blood Cells): 5.00 Mio/ul (reference: 4.50-5.90)
- Leukozyten (White Blood Cells): 4.55 Tsd./ul (reference: 4.40-11.30)
- MCH (Mean Corpuscular Hemoglobin): 30.4 pg (reference: 28.0-33.0)
- Hämatokrit (Hematocrit): 44.9% (reference: 40.0-52.0)
- MCHC (Mean Corpuscular Hemoglobin Concentration): 33.9 g/dl (reference: 32.0-36.0)
- MCV (Mean Corpuscular Volume): 89.8 fl (reference: 80.0-96.0)
-
Thrombozyten (Platelets): 149 Tsd/ul (reference: 140-440)
- Diabetes Markers
- HbA1c (NGSP) (Glycated Hemoglobin): 5.02% (reference: <5.7)
- HbA1c (IFCC): 31.3 mmol/mol (reference: <39)
- Glucose (Nüchtern-Blutzucker): 77 mg/dl (reference: 70-110)
- Liver Function
- GOT (AST) (Aspartate Aminotransferase): 29 U/l (reference: <35)
- Kidney Function
- Kreatinin (Creatinine): 1.14 mg/dl (reference: <1.20)
- GFR CKD-EPI (Glomerular Filtration Rate): 86 ml/min/1.73m² (based on CKD-EPI formula)
- Lipid Panel (Fettstoffwechsel)
- Gesamtcholesterin (Total Cholesterol): 232 mg/dl (reference: <200) [ELEVATED]
- HDL-Cholesterin (HDL Cholesterol): 66 mg/dl (reference: >40)
- LDL-Cholesterin enzymatisch (LDL Cholesterol): 135 mg/dl (reference: <130) [SLIGHTLY ELEVATED]
- LDL/HDL Ratio: 2.0 (reference: <3)
- Triglyzeride (Triglycerides): 82 mg/dl (reference: <200)
- Thyroid Function
- TSH (Thyroid-Stimulating Hormone): 1.610 µU/ml (reference: 0.400-4.000)
- Klinische Chemie (Clinical Chemistry):
- 2023-05-22 (ordered by Dr. Harald Menker, my Hausarzt in Netphen; draw date 22.05.2023, printed 30.05.2023)
-
Note on parsing: the source printout has a one-row column misalignment (units/values shifted). The values below are the realigned, corrected reading. Cross-checks confirm the correction: the WBC differential sums to exactly 100.0%, the lipids satisfy the Friedewald equation (LDL ≈ 190 − 53 − 107/5 = 115.6), and LDL/HDL = 115/53 = 2.2 matches the printed ratio.
- Complete Blood Count:
- Hämoglobin: 14.7 g/dl (reference: 14.0-17.5)
- Erythrozyten: 4.88 Mio/µl (reference: 4.50-5.90)
- Hämatokrit: 43.4% (reference: 40.0-52.0)
- MCV: 88.9 fl (reference: 80.0-96.0)
- MCH: 30.1 pg (reference: 28.0-33.0)
- MCHC: 33.9 g/dl (reference: 32.0-36.0)
- Leukozyten: 4.02 Tsd/µl (reference: 4.40-11.30) [SLIGHTLY LOW] — consistent with my generally low-normal WBC (4.55 in Apr 2025, 4.2 in May 2026)
- Thrombozyten: 148 Tsd/µl (reference: 140-440)
- Neutrophile: 47.6% (reference: 38.9-75.1)
- Lymphozyten: 38.1% (reference: 12.8-43.9)
- Monozyten: 11.7% (reference: 4.4-12.3) — high-normal
- Eosinophile: 1.7% (reference: <7)
- Basophile: 0.7% (reference: <2.5)
- Unreife Granulozyten: 0.2% (reference: <0.6)
- Inflammation:
- BSG (ESR): 1 mm (reference: <15)
- Diabetes Markers:
- Glukose: 82 mg/dl (reference: 70-110)
- HbA1c: 5.46% (reference: <5.7)
- Kidney Function:
- Kreatinin: 1.02 mg/dl (reference: <1.20) — notably better than my later readings (1.27-1.30 in 2025-2026); supports the muscle/creatine-load confounder story, since kidney function itself was clearly normal here
- GFR CKD-EPI: 100 ml/min/1.73m² — also better than the later 73-86, same reason
- Liver Function:
- Gamma-GT: 16 U/l (reference: <55)
- GOT (AST): 25 U/l (reference: <35)
- GPT (ALT): 20 U/l (reference: <45)
- Lipid Panel:
- Gesamtcholesterin: 190 mg/dl (reference: <200)
- HDL-Cholesterin: 53 mg/dl (reference: >40)
- LDL-Cholesterin enzymatisch: 115 mg/dl (reference: <130)
- LDL/HDL Ratio: 2.2 (reference: <3)
- Triglyzeride: 107 mg/dl (reference: <200)
- (No Lp(a) measured at this draw.)
- Electrolytes:
- Kalium: 3.89 mmol/l (reference: 3.60-5.50)
- Thyroid Function:
- TSH: 2.345 µU/ml (reference: 0.400-4.000)
-
Blood Donations
- 2026-04-24: Bludspende DRK in der City Galerie (Rotaract Club Siegen)
- 2025-02-13: Blutspende DRK im Marienkrankenhaus
Vaccinations
- 1995-01-05: [[Ruberkulose (BCG), Tuberculosis]]
- 1995-03-15: [[Diptherie, Diphteria]]
- 1995-03-15: [[Tetanus]]
- 1995-03-15: [[Pertussis, Coqueluche]]
- 1995-03-15: [[Haemophilus influenzae b (Hib)]]
- 1995-03-15: [[Polio]]
- 1995-04-19: [[Diptherie, Diphteria]]
- 1995-04-19: [[Tetanus]]
- 1995-04-19: [[Pertussis, Coqueluche]]
- 1995-04-19: [[Haemophilus influenzae b (Hib)]]
- 1995-06-20: [[Polio]]
- 1995-06-20: [[Diptherie, Diphteria]]
- 1995-06-20: [[Tetanus]]
- 1995-06-20: [[Pertussis, Coqueluche]]
- 1995-06-20: [[Haemophilus influenzae b (Hib)]]
- 1996-02-20: [[Masern, Measles]]
- 1996-02-20: [[Mumps, Oreillons]]
- 1996-02-20: [[Röteln, Rubella]]
- 1996-10-17: [[Diptherie, Diphteria]]
- 1996-10-17: [[Polio]]
- 1996-10-17: [[Tetanus]]
- 1996-10-17: [[Pertussis, Coqueluche]]
- 1996-10-17: [[Haemophilus influenzae b (Hib)]]
- 2000-03-23: [[Virushepatitis B, infektiöse Gelbsucht Typ B]]
- 2000-05-10 [[Virushepatitis B, infektiöse Gelbsucht Typ B]]
- 2001-05-18: [[Virushepatitis B, infektiöse Gelbsucht Typ B]]
- 2011-08-15: [[Virushepatitis B, infektiöse Gelbsucht Typ B]]
- 2001-06-19: [[Masern, Measles]]
- 2001-06-19: [[Mumps, Oreillons]]
- 2001-06-19: [[Röteln, Rubella]]
- 2001-09-06: [[Diptherie, Diphteria]]
- 2001-09-06: [[Tetanus]]
- 2002-03-25: [[Polio]]
- 2002-03-25: [[Diptherie, Diphteria]]
- 2002-03-25: [[Tetanus]]
-
2002-03-25: [[Pertussis, Coqueluche]]
- [[FSME]]
- 2003-08-07
- 2003-08-21
- 2004-08-10
- 2012-08-15
- 2012-09-20
- 2017-03-06
- 2005-09-15: [[Polio]]
- 2005-09-15: [[Diptherie, Diphteria]]
- 2005-09-15: [[Tetanus]]
- 2005-09-15: [[Pertussis, Coqueluche]]
- 2011-08-15: [[Polio]]
- 2011-08-15: [[Diptherie, Diphteria]]
- 2011-08-15: [[Tetanus]]
- 2011-08-15: [[Pertussis, Coqueluche]]
- 2011-08-15: [[Masern, Measles]]
- 2011-08-15: [[Mumps, Oreillons]]
- 2011-08-15: [[Röteln, Rubella]]
- 2011-08-15: [[Haemophilus influenzae b (Hib)]]
- 2012-09-12 [[Mutagrip]] [[Grippe, Cold, Flu, Erkältung]]
- 2016-04-27 [[Prevenar]]
-
2016-11-11 Varicella Titer [[Windpocken]]
- 2018-12-10
- [[Tetanus]]
- [[Diptherie, Diphteria]]
- [[Pertussis, Coqueluche]]
- 2008-12-12
- [[Tetanus]]
- [[Diptherie, Diphteria]]
- [[Pertussis, Coqueluche]]
- [[Polio]]
- 2020-10-20 [[Influsplit]] [[Grippe, Cold, Flu, Erkältung]]
- 2021-07-08 Ch.B.: FD9234 [[Covid Vaccine, Coronaimpfung, Corona Vaccination, Covid-19]] [[Comirnaty]]
- 2021-08-09 Ch.B.: 1D020A [[Comirnaty]]
- 2021-12-21 Ch.-B.: 1F1022A [[Comirnaty]]
- 2021-09-20 [[Influvac]] [[Grippe, Cold, Flu, Erkältung]]
- 2022-08-16: [[Covid-19, Spikevax (Moderna) 1st dose]]
- 2022-09-13: [[Covid-19, Spikevax (Moderna) 2nd dose]]
- 2022-10-18: [[Covid-19, Spikevax (Moderna) Booster]]
X-Rays, Imaging, and Long-Haul Flights (for Radiation Load)
2025-12-16 Dental X-Ray (Röntgenbild Gebiss)
Estimated radiation load: 0.02 – 0.2 mSv.
Outcome: Everything ok in the mouth.
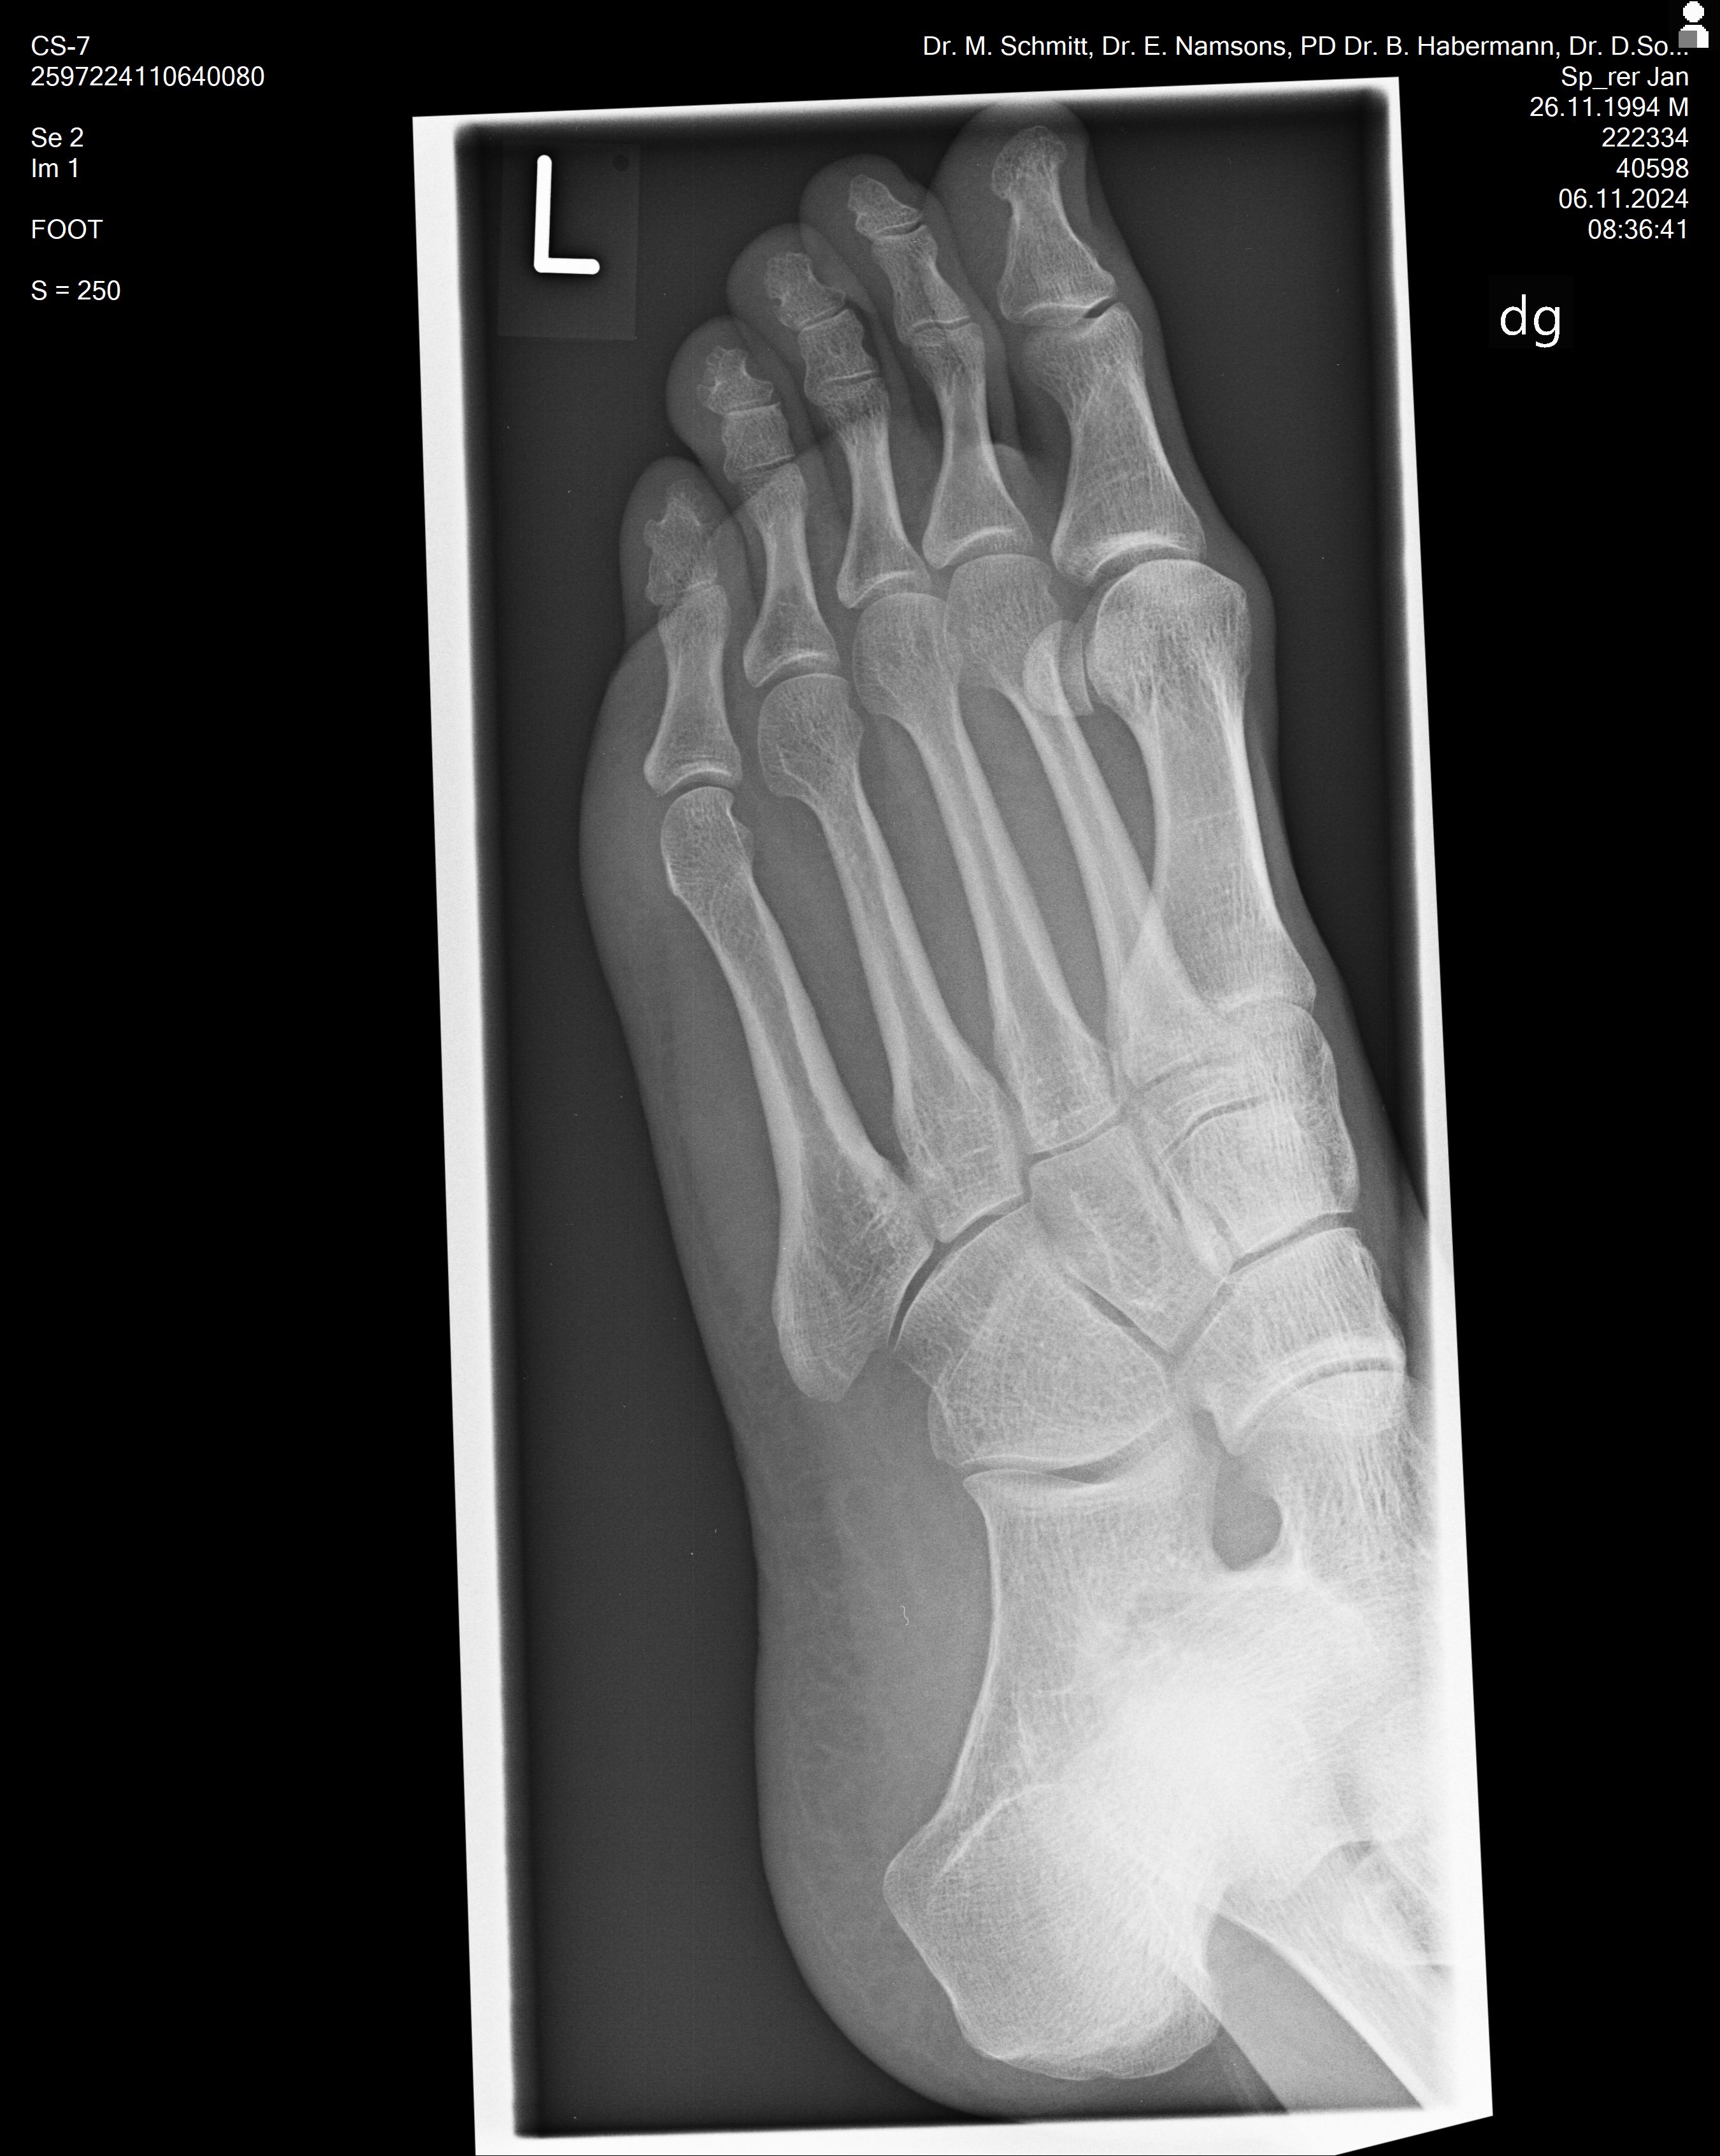
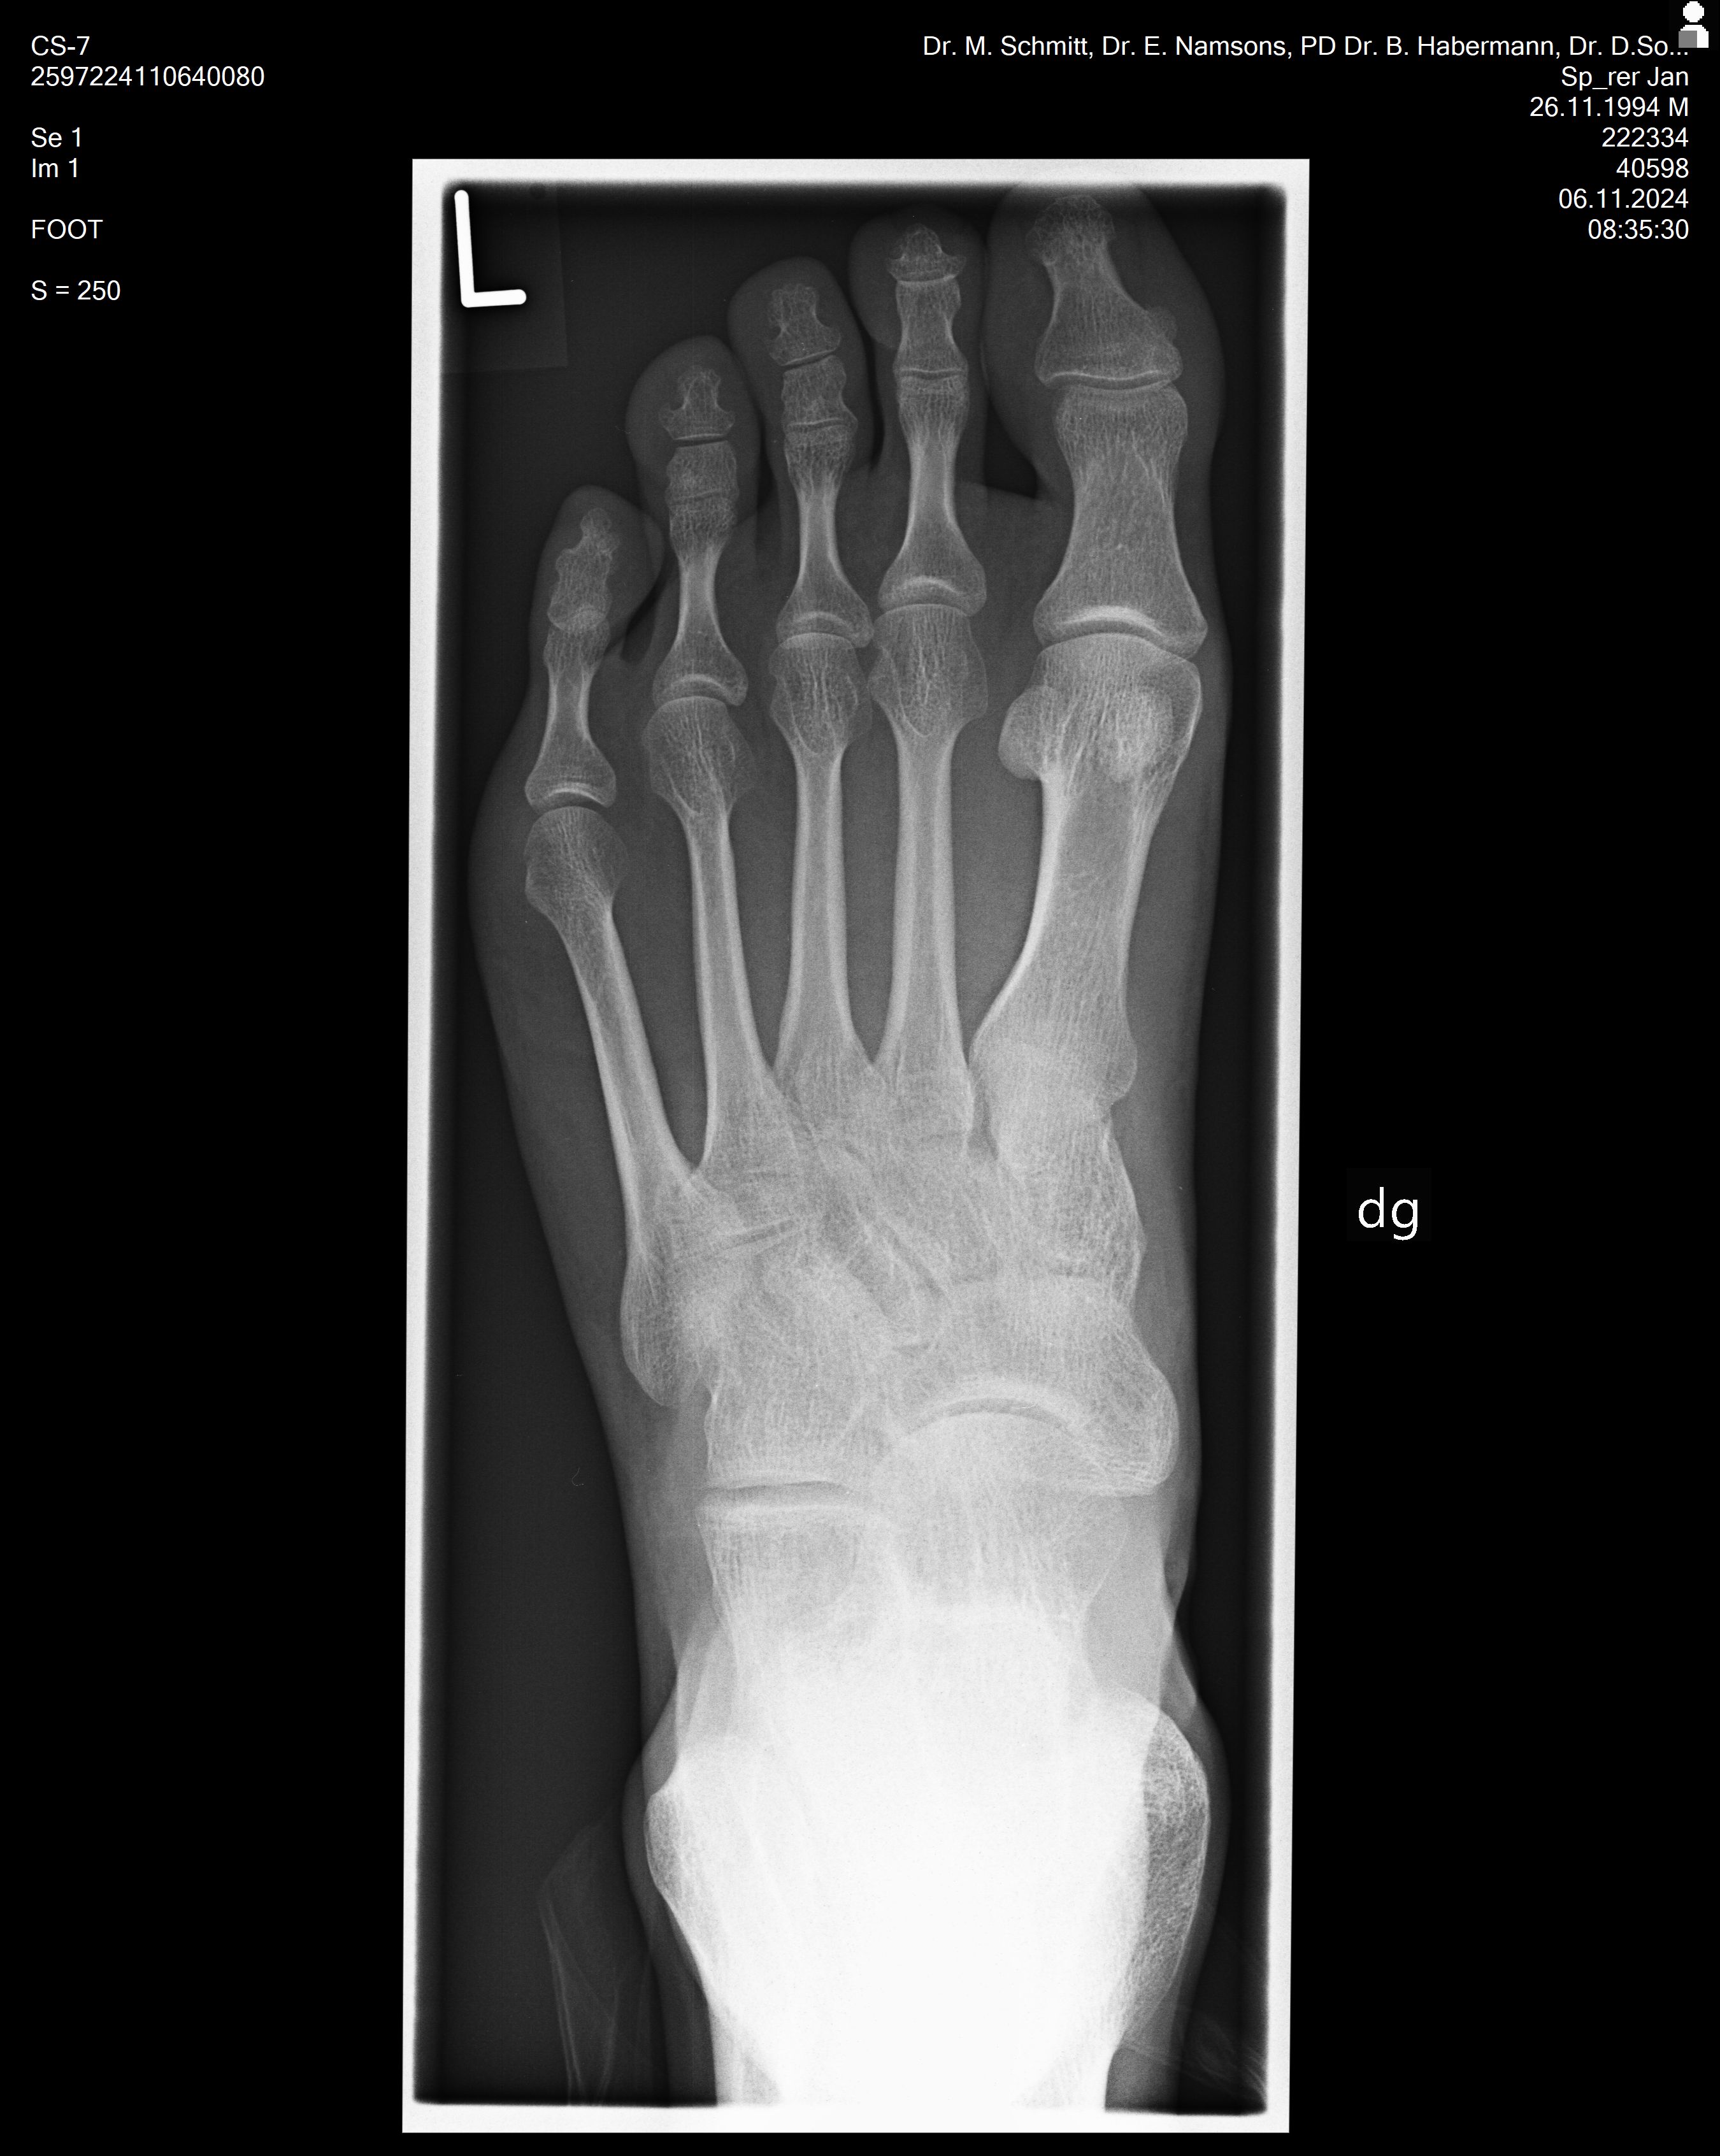
2024-11-06 Foot X-Rays (Röntgenbilder Füße)
Radiation load: 0.006 – 0.1 mSv. Likely more like 0.006 mSv or less because a Weight-Bearing Cone Beam CT was used.
Outcome: I ran a marathon that year and had some pain in my feet as a result of my training and the marathon. I thought my feet may have a fracture, but everything turned out to be ok in the feet. The pain went away since then.
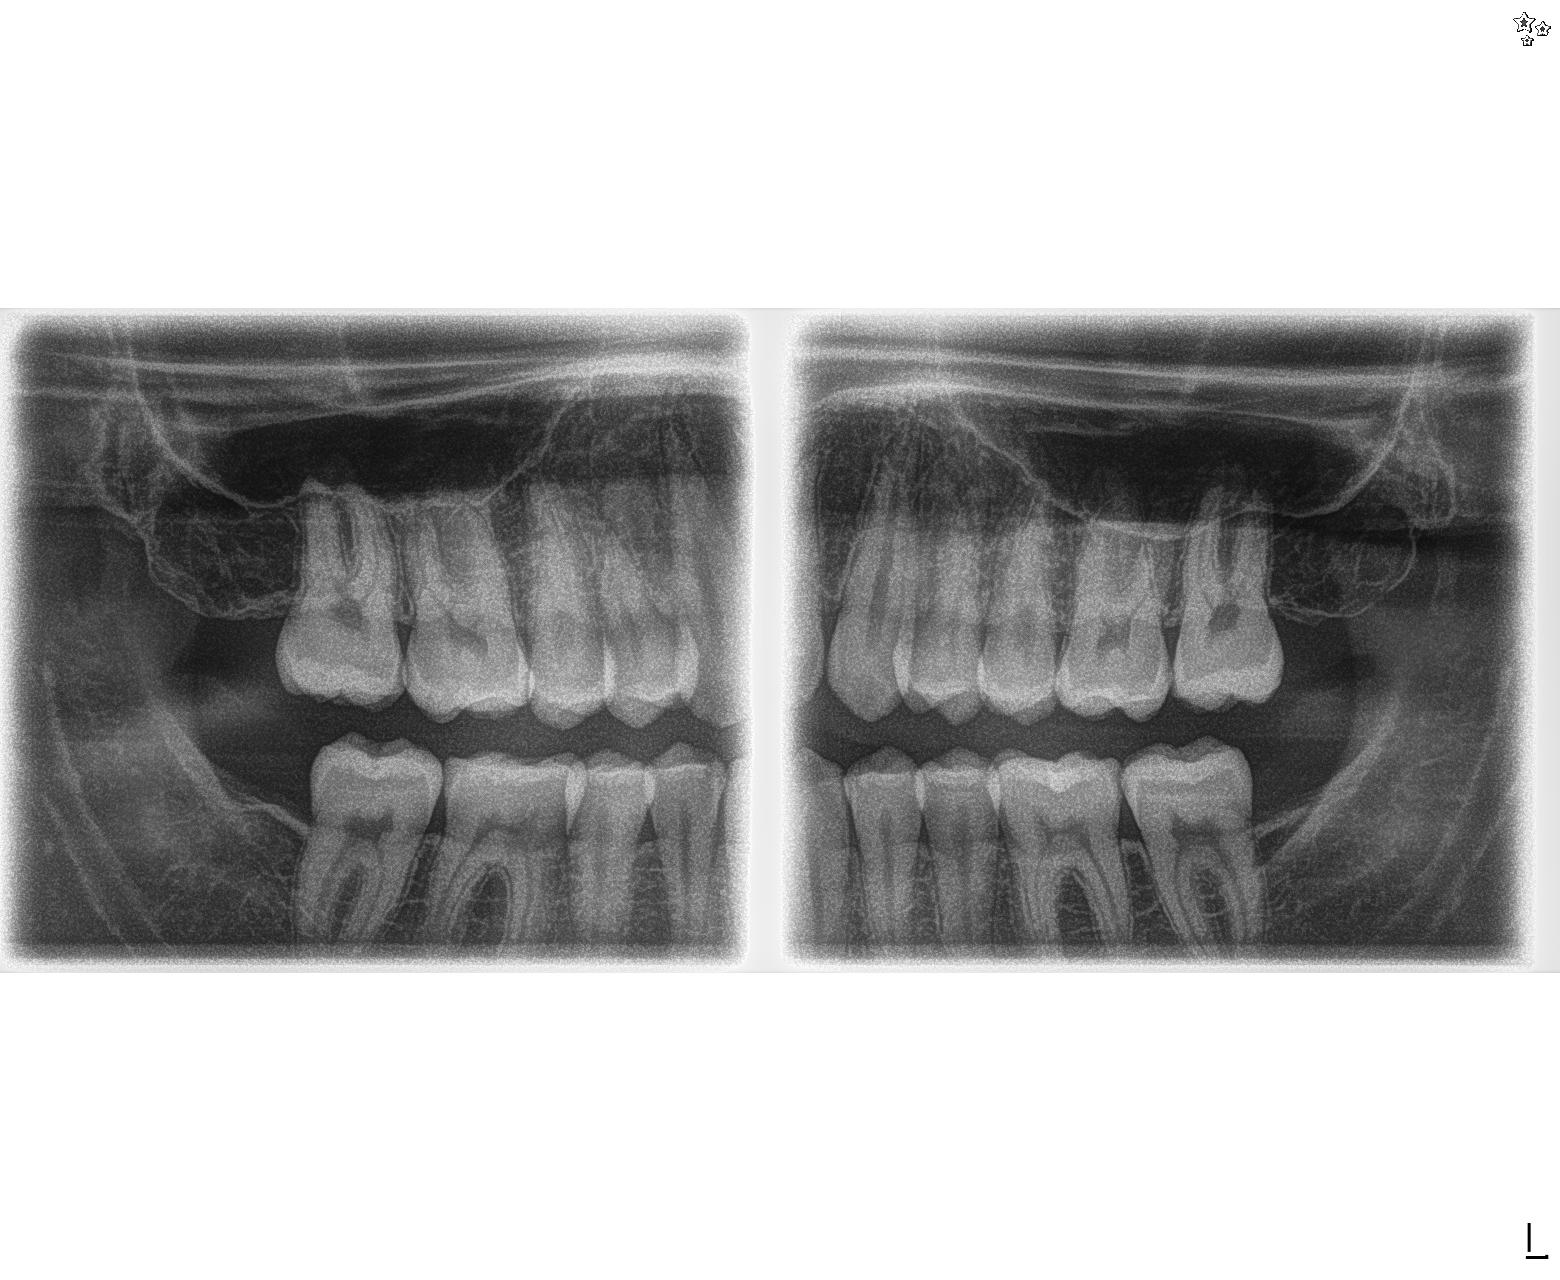
2020-07-21 Dental X-Ray (Röntgenbild Gebiss)
Estimated radiation load: 0.02 – 0.2 mSv.
Outcome: Everything ok in the mouth.
Cardiovascular & Pulmonary Assessments
2026-05-12 Arteriograph (Pulse Wave Analysis)
Performed at Die Kardiologen Bad Nauheim on a TensioMed Arteriograph (oscillometric, suprasystolic).
- Brachial (peripheral) blood pressure: 139/87 mmHg, PP 52 mmHg, MAP 104 mmHg, HR 60/min
- Central aortic hemodynamics:
- SBPao (central systolic): 124.6 mmHg (reference <140) — central pressure is healthy
- PPao (central pulse pressure): 37.6 mmHg (reference <50)
- Aix aortic (Augmentation Index): 7.8% (reference <33) — small-artery function looks good
- PWVao (aortic pulse wave velocity): 6.9 m/s (reference <10)
- RT (reflection time): 169 ms (reference ≥124) — aortic wall stiffness is normal
- Ejection duration: 310 ms
- Volumetric test: DRA 76 (good, ≥40), SAI 47.1% (good, ≤50), DAI 52.9% (good, ≥50)
- Quality: SD 0.23 m/s (deep in green range)
- Befund: “Die arteriellen Funktionsparameter sind in Ordnung.”
- Caveat on the percentile placement: the Arteriograph device had my date of birth entered incorrectly as 05/08/1998 (age 27 instead of the actual 31). The PWV percentile is therefore plotted against the population mean for 27-year-olds (6.8 m/s). At my actual age (31) the population mean is slightly higher, so 6.9 m/s is closer to the 50th percentile than the report suggests. The absolute measurement is unaffected.
2026-05-12 Resting ECG
- Sinusrhythmus, heart rate 57/min, Steiltyp (steep axis, QRS 91°)
- PQ 125 ms, QRS 111 ms, QT 374 ms, QTc 368 ms (94%)
- Sokolow-Lyon-Index: 2.26 mV
- No block patterns, no hypertrophy signs, no ST-segment changes, no extrasystoles, no rhythm disturbances
- Zusammenfassung: “Altersentsprechender Normalbefund bei Steiltyp”
2026-05-12 Stress ECG (Bicycle Ergometry, Stepwise)
Protocol: starting at 50 W, +25 W every 2 min.
- Total duration: 22:05 min (16:22 load + 4:43 recovery)
- Max load: 250 W — 116% of target (214 W)
- Max HR: 178/min — 105% of target (169/min)
- Resting BP: 142/89 mmHg
- Max BP: 207/104 mmHg (appropriate rise)
- HR × BD max: 36,846
- Max MET: 12.9
- PWC170: 187 W = 2.6 W/kg (104% of target)
- PWC150: 151 W = 2.1 W/kg (105%)
- PWC130: 119 W = 1.7 W/kg (110%)
- Reason for termination: muscular exhaustion (not cardiac symptoms)
- Report wording: “no pectanginal symptoms, no dyspnoea, no ventricular rhythm disturbances, no significant repolarization disturbances; 4 isolated VES (ventricular extrasystoles) counted.”
- Note: I was fully exhausted both regarding heart rate and wattage.
2026-05-12 Ankle-Brachial Index (Knöchel-Arm-Index, ABI)
Performed at 09:47 on a boso device.
- Right brachial BP: 124/76 mmHg, PP 48, pulse 56/min, no arrhythmia
- Left brachial BP: 124/78 mmHg, PP 46, pulse 56/min, no arrhythmia
- Inter-arm difference: 0 mmHg systolic, 2 mmHg diastolic (excellent symmetry)
- Right ankle systolic: 142 mmHg
- Left ankle systolic: 140 mmHg
- ABI right: 1.15 (>0.90 = no PAD) ✓
- ABI left: 1.13 (>0.90 = no PAD) ✓
- Befund: no peripheral artery disease, symmetric, in the ideal range.
Useful side observation — my blood pressure sequence that morning:
| Time | Measurement | BP (brachial) |
|---|---|---|
| 09:47 | ABI (boso) | 124/76 / 124/78 |
| 09:53 | Arteriograph (TensioMed) | 139/87 |
| 10:34 | Stress test pre-exercise | 142/89 |
The ~15 mmHg systolic gap between the ABI reading and the Arteriograph reading just 6 minutes later strongly supports the white-coat / measurement-context hypothesis I noted in the Arteriograph section. My true resting brachial BP that morning was probably closer to 124/77 than to 139/87 — so the BP “trend” since 2025-04-01 is less alarming than the Arteriograph snapshot suggested.
2026-05-12 Lung Function Test (Spirometry)
Device: custo vit m / spiro mobile. Weight entered into the device: 72.0 kg (actual was 76.8 kg per the seca measurement ~30 min earlier; spirometry predicted values don’t depend on weight, so this doesn’t affect interpretation).
- IVC: 4.98 L (82% of target)
- FVC: 4.97 L (Z-score −1.49, 82% of target; LLN 4.86 L — measured value is just above LLN)
- FEV1: 4.89 L (Z-score −0.05, 99% of target)
- PEF: 8.16 l/s (80% of target)
- FEF25-75%: 6.29 l/s (Z-score +1.06, 130% of target)
- FEF75%FVC: 4.27 l/s (Z-score +2.09, 209% of target)
- FEV1/FVC: 0.98 (Z-score +3.24, 120% of target)
- Lung age: 21 (actual age: 31)
- Befund: “Normale, altersentsprechende Werte u.a. der VC und FEV1. Keine Zeichen der Obstruktion. Befund klinischer Auswertung gemäß GLI: Normal.” Nichtraucher.
Subtle pattern worth flagging on a closer read of the numbers (the cardiologist signed off as “Normal” but the underlying shape of the curve is interesting):
- FVC at 82% predicted (Z −1.49) is just above the Lower Limit of Normal (Z cutoff is −1.645). So forced vital capacity sits at the bottom edge of the normal range.
- The FEV1/FVC ratio of 0.98 is unusually high. Normal is roughly 0.75-0.85; 0.98 means nearly all of the measured vital capacity was exhaled in the first second.
- Late-expiratory flow rate (FEF75%FVC) at 209% of predicted also looks “too good”.
This pattern (high ratio + low-normal FVC + normal FEV1) typically reflects one of two things:
- Most likely: suboptimal test technique. A proper FVC maneuver requires exhaling all the way down to residual volume (typically 6+ seconds). If exhalation is cut short at 3-4 seconds, the device records a lower FVC, FEV1 (a first-second measure) is unaffected, and the ratio gets inflated. The volume-over-time trace on the report ends between seconds 4-5, which is on the short side. This would also explain the inflated late-expiratory flow rates.
- Less likely: a very mild restrictive component. True restriction (low FVC, normal FEV1, high ratio) can arise from chest wall stiffness, mild fibrosis, neuromuscular weakness, or extreme fitness reducing chest compliance. Body plethysmography (Total Lung Capacity measurement) would be needed to confirm or rule this out — spirometry alone can’t distinguish (1) from (2).
Given the lung age of 21, an excellent stress test (250 W = 116% of target, MET 12.9), no symptoms, and a non-smoker history, this is almost certainly explanation (1) — i.e., the test could have used a longer forced exhale. Worth one sentence of confirmation with the cardiologist next time.
Flights (Radiation Load)
- 2025: Multiple flights, longest flight was to Singapore. Radiation load: ~0.03 – 0.05 mSv x 2. Plus the shorter flights.
- 2024: Multiple flights, longest flight was to New York. Radiation load: ~0.03 – 0.08 mSv x 2. Plus the shorter flights.
- 2023: Multiple flights, longest flight was to New York. Radiation load: ~0.03 – 0.08 mSv x 2. Plus the shorter flights.
Lifestyle Changes
- 2026-02: Around Febuary 2026, I cut my coffee consumption by about 95%. I read a study about the effects of workplace coffee (cafe crema) on LDL-C. The filtering of these machines is more coarse than that of filters, meaning that harmful components stay in the coffee, increasing LDL-C. I continue drinking about 2-3 liters of Gyokuro green tea every day and almost nothing else.
Diseases & Accidents
- None important to report.
Treatments & Measures
- 2026-05-28 Considering Combination Lipid-Lowering Therapy
- Considering 10 mg ezetimibe + 10 mg rosuvastatin daily as an intervention against the elevated Lp(a) (78 mg/dl / 167 nmol/l), the LDL rebound to 150 mg/dl, and ApoB 115 mg/dl.
- Rationale: ezetimibe + rosuvastatin combinations are well-established and typically achieve ~50-60% LDL reduction. While statins do not lower Lp(a) directly (and may slightly raise it), aggressive LDL/ApoB lowering is the most evidence-backed way to reduce overall cardiovascular risk in someone with high Lp(a).
- Will discuss with Dr. Haas (Die Kardiologen Bad Nauheim) before starting.
- 2026-05-28 Sardine Diet Plan (Short-Term Cut)
- Plan: ~8 cans of sardines per day plus 2 protein shakes for a couple of weeks, with the goal of a moderate caloric deficit to reduce body fat back toward 2022 levels.
- Math: 8 cans × 120 g × ~210 kcal/100 g (in oil) ≈ 2,016 kcal from sardines + ~240 kcal from shakes ≈ ~2,260 kcal/day total. Against an estimated TEE of ~2,800 kcal/day (seca REE 1,841 × PAL ~1.5), that is a ~500-550 kcal/day deficit.
- Macros (approximate): ~265 g protein, ~110 g fat (very omega-3-heavy), low carb.
- Things I will monitor / mitigate:
- Sodium: ~3,200 mg/day from sardines, ~1.5× WHO upper limit. Will rinse cans and pick low-sodium varieties when available. Given my brachial BP just drifted up to 139/87, this matters.
- Purines: sardines are very purine-dense. Uric acid is already at 6.7 mg/dl (top of normal). Will hydrate well and stop the diet at any sign of joint pain.
- Omega-3 / bleeding risk: 10-15 g EPA+DHA/day is large, especially combined with my 100 mg daily aspirin. Will discuss aspirin discontinuation with Dr. Haas.
- Calcium: ~3,600 mg/day from bone-in sardines (8 × 120 g × ~380 mg/100 g), well above the 2,500 mg/day Tolerable Upper Intake Level. Combined with my already-high vitamin D (92.48 ng/ml), risk of hypercalcemia. Will pause vitamin D supplementation during the diet.
- 2026-05-12 Thorough Cardiology Check at Die Kardiologen Bad Nauheim
- Comprehensive cardiology workup: resting ECG, stress ECG (bicycle ergometry up to 250 W), arteriograph (pulse wave analysis), spirometry, body composition (seca mBCA), and an extensive lab panel.
- Headline results: Cardiac function and vessel stiffness are excellent (PWVao 6.9 m/s, lung age 21, max load 250 W = 116% of target). No structural or rhythm concerns on ECG or stress test. ABI 1.15/1.13 — no PAD.
- New findings to address:
- Lp(a) confirmed elevated: 78 mg/dl (167 nmol/l, ref <75 nmol/l) on the May 2026 assay, and 63 mg/dl (ref <30 mg/dl) on the Oct 2025 assay. Different assays and only the May panel reported the nmol/l value, so the readings are not directly comparable, but both are roughly 2× their respective upper-reference cutoffs. This is a confirmed elevated genetic risk factor and lifestyle changes are not expected to move it.
- LDL rebound to 150 mg/dl after the 110 mg/dl in Nov 2025, despite the coffee reduction. ApoB at 115 mg/dl high-normal.
- Iron status borderline low (Ferritin 41.4, Transferrinsättigung 13.6%). Likely transient effect of the blood donation 18 days earlier; will recheck.
- Vitamin D too high at 92.48 ng/ml — supplement dose needs reduction.
- Total IgE elevated at 105 kU/l (“allergy likely” range), despite no current symptoms.
- Body fat creeping up: 14.3% / 11 kg fat at 76.8 kg, vs. ~6% / 4-5 kg fat at peak fitness in 2022. Still in normal range but the trend is clearly toward more fat and less muscle. I will be more disciplined with diet and resistance training.
- 2026-03 Adjustment of my Supplement Stack
- See the section “Daily Supplement Stack” below.
- 2025-11 Lipoprotein A Lp(a) Reduction Measures
- Planning to take L-lysine, L-proline, and vitamine C if the Pauling-Rath hypothesis turns out to be worth a try.
- Considering PCSK9 inhibitors.
- -> No action taken against Lp(a) yet.
Daily Supplement Stack (Since March 2026)
Morning:
- 100 mg aspirin
- 4,000–20,000 IU vitamin D
- 320 mg saw palmetto extract (20:1)
- 1 g omega-3 algae oil (40% DHA)
- 25 mg chelated zinc
- 1 mg copper
- 100 mg vitamin K2
- 10 g creatine
Evening (occasional):
- 1–2 mg melatonin
- Magnesium (variable dose)
Infrequently:
- ~1 tsp whey protein powder
- ~1 tsp vegan protein powder
- Vitamin C (powder form, variable dose, but usually pretty high)
A Note on Optimal Levels
- LDL Cholesterol
- Evidence: Large observational studies (like the Denmark General Population Study and Pittsburgh Healthcare System study) consistently find that all-cause mortality is lowest at moderate levels of LDL, typically between $100\text{–}140\text{ mg/dL}$.
- The Paradox: People with naturally very low LDL ($<70\text{ mg/dL}$) in the general population often have higher rates of cancer and infection. While this may be reverse causality (sickness causes low LDL), independent researchers argue that aggressive lowering in healthy elderly people may not yield a net survival benefit.
- HDL Cholesterol
- Verdict: Goldilocks Zone (Not “Higher is Better”).
- The Range: Optimal survival is typically seen with HDL levels between $40\text{–}80\text{ mg/dL}$.
Summary of Lipid Panel
Timeline: the earliest data point is May 2023 (LDL 115, total 190) — so my LDL has been sitting in the 110-150 band for at least three years, and the May 2026 reading of 150 is the top of a long-standing range rather than a new event. The Apr 2025 panel was high (LDL 135), the Nov 2025 panel had improved (LDL 110, total 188), then in Feb 2026 I cut cafe-crema-style workplace coffee by ~95%. The May 2026 panel is the first reading after that lifestyle change — and despite the coffee reduction, total cholesterol and LDL rebounded to 215 and 150 mg/dl respectively. So the LDL improvement seen in Nov 2025 was probably not driven by coffee. The Lp(a) elevation, separately, is a genetic risk factor and remains the single largest cardiovascular signal I am tracking.
| Marker | May 22, 2023 | Apr 01, 2025 | Oct 08, 2025 | Nov 11, 2025 | May 12, 2026 | Reference | Status (May) |
|---|---|---|---|---|---|---|---|
| Total Cholesterol | 190 mg/dl | 232 mg/dl | — | 188 mg/dl | 215 mg/dl | < 200 mg/dl | Borderline high |
| LDL | 115 mg/dl | 135 mg/dl | — | 110 mg/dl | 150 mg/dl | < 116 mg/dl | Elevated |
| HDL | 53 mg/dl | 66 mg/dl | — | 57 mg/dl | 71 mg/dl | > 40 mg/dl | High (good) |
| Non-HDL | 137 mg/dl | — | — | — | 144 mg/dl | < 145 mg/dl | Borderline |
| Triglycerides | 107 mg/dl | 82 mg/dl | — | 49 mg/dl | 68 mg/dl | < 150 mg/dl | Excellent |
| Lp(a) | — | — | 63 mg/dl (ref <30) | — | 78 mg/dl / 167 nmol/l (ref <36 / <75) | (assay-dependent) | High |
| Apolipoprotein B | — | — | — | — | 115 mg/dl | 66-144 mg/dl | High-normal |
Note on Lp(a) trend: the Oct 2025 and May 2026 results used different reference ranges (<30 vs. <36 mg/dl), which strongly suggests different assays. The two readings are therefore not a clean apples-to-apples comparison, although both are clearly elevated (2.1× and 2.2× their respective upper-reference cutoffs). The April and November 2025 panels did not include Lp(a) — it was measured separately at the Oct 2025 draw.